How to use the Stochastic indicator – From basics to advanced
Hello, everyone! Today, let’s explore with Trade Viet Stock how to use the Stochastic RSI indicator—a popular and effective technical analysis tool that helps investors identify trends. This is an upgraded version of the basic RSI. If you’re new to the financial world, this tool will be incredibly useful!

i. What is Stochastic RSI?
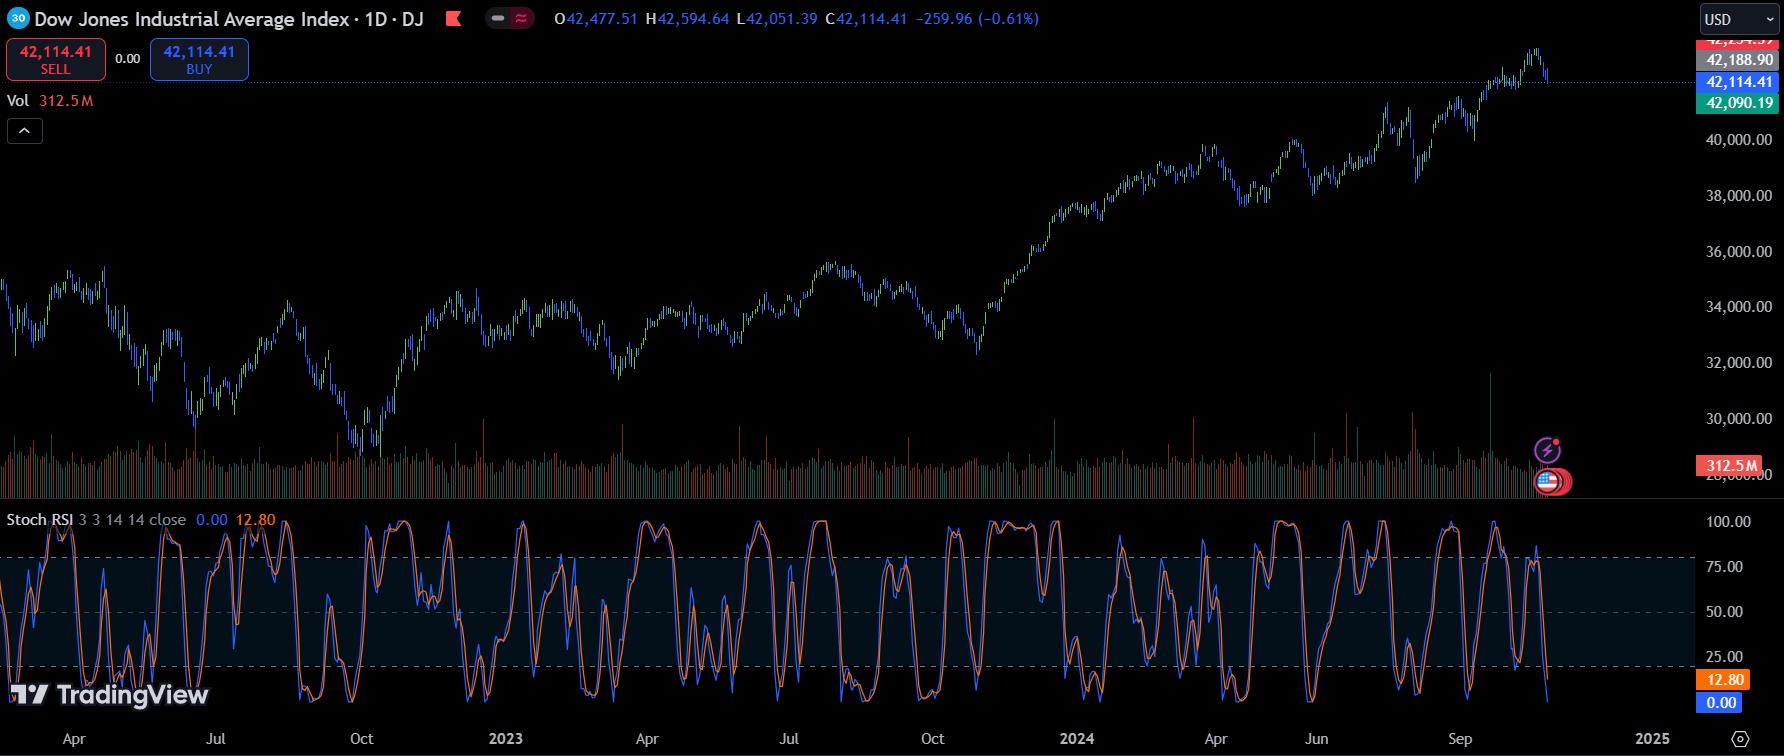
The Stochastic RSI (or Stoch RSI) is an indicator developed from the traditional RSI, based on comparing the closing price with a range over a specific period (typically 14 sessions). Introduced in 1994, Stochastic RSI operates on a scale from 0 to 100, making it easier for investors to spot overbought levels (above 80) and oversold levels (below 20).
ii. The Significance of Stochastic RSI
1. Identifying Overbought/Oversold Levels
When Stochastic RSI surpasses 80, the market might be overbought, signaling a potential downward adjustment. Conversely, when it drops below 20, the market may be oversold, presenting a buying opportunity.
2. Reversal Signals
Stochastic RSI typically includes two lines: %K (reflecting the current value) and %D (a moving average of %K). When these two lines cross, it can indicate a potential reversal, helping investors determine more effective entry points.
iii. Stochastic RSI Calculation Formula
Stochastic RSI formula:
Stochastic RSI = (Current RSI – Lowest RSI) / (Highest RSI – Lowest RSI)
Where:
- Current RSI is the current RSI value.
- Lowest RSI and Highest RSI are the lowest and highest RSI values over the chosen period (typically 14 sessions).
iv. Using Stochastic RSI in Trading
1. Identifying Market Trends
This is the most basic way to use the Stochastic indicator.
a. Bullish Trend:
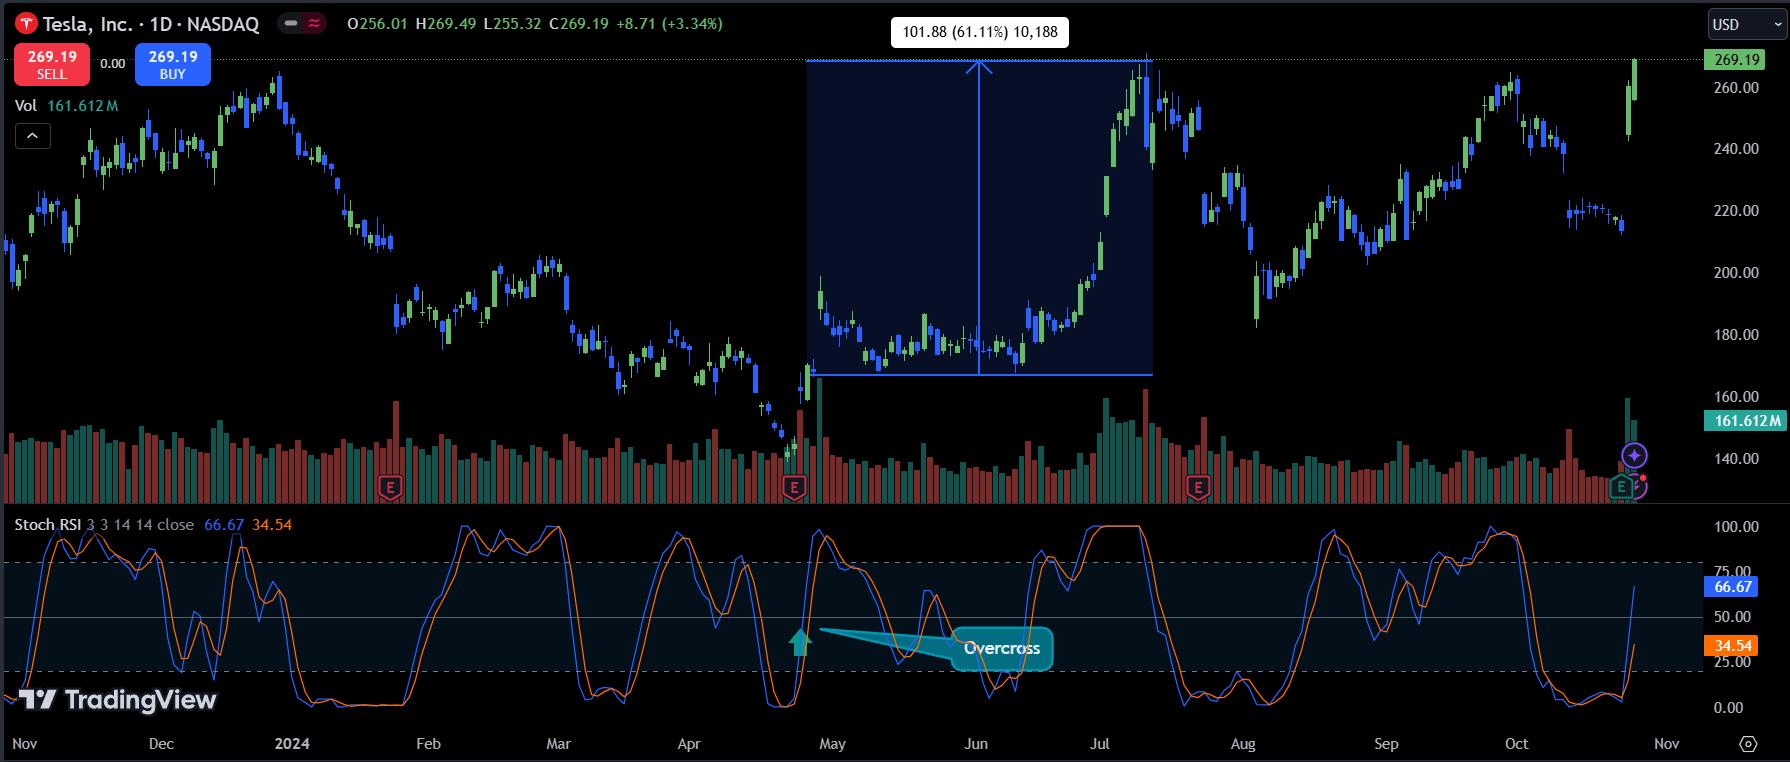
When RSI is above 50, we can interpret this as an upward trend, and investors should consider buying. For example, as shown below, when Tesla (TSLA) crosses above the Stochastic RSI’s moving average, TSLA’s price surged by 61%.
b. Bearish Trend:
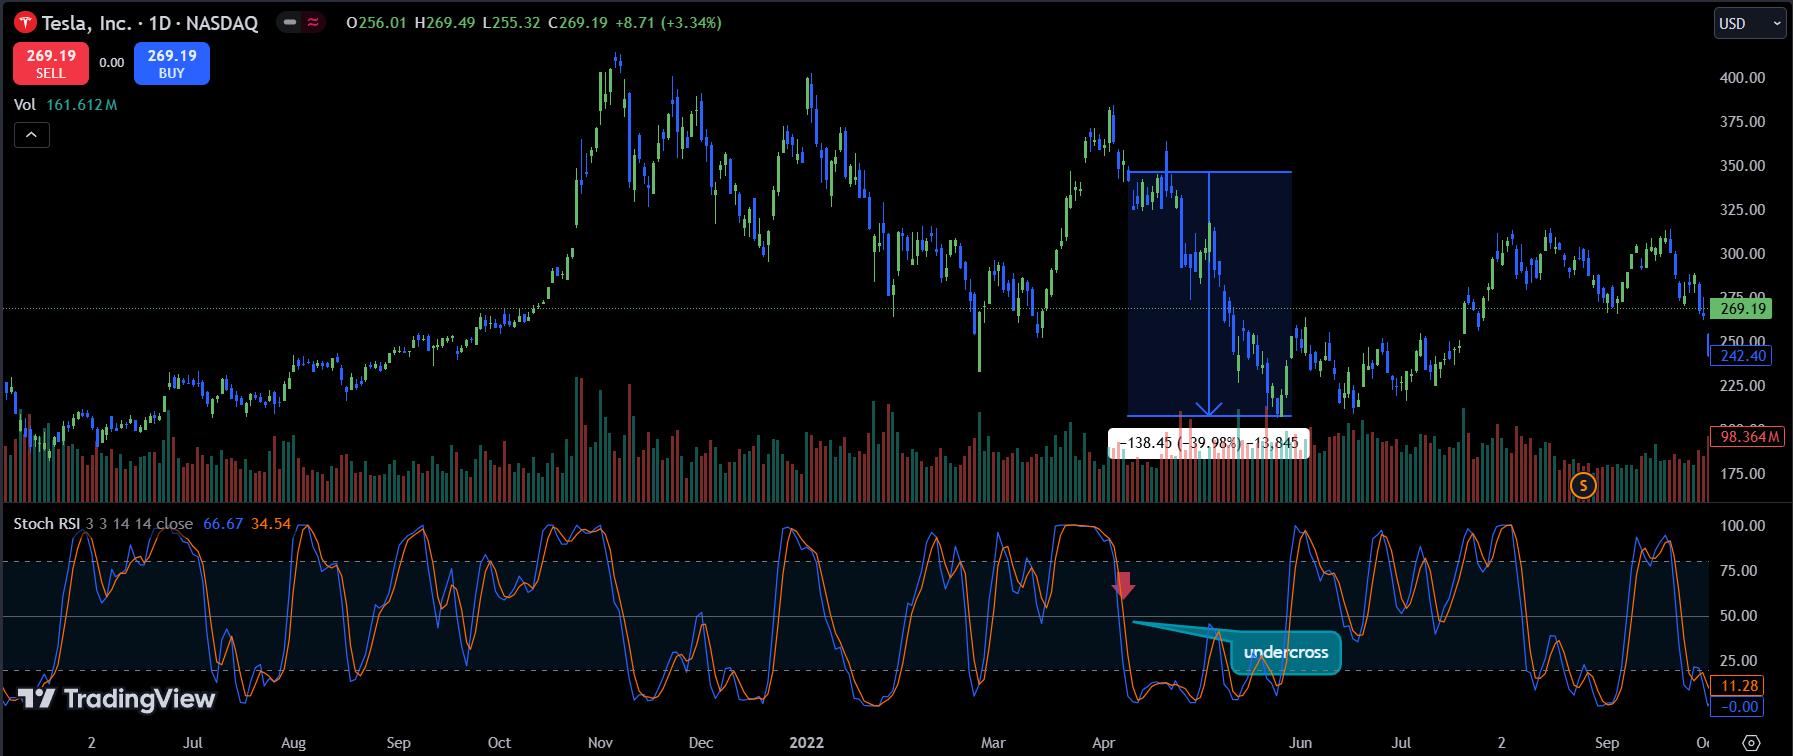
When RSI falls below 50, this signals a downward trend, suggesting investors should sell. For instance, with TSLA again, when the price dropped below the Stochastic RSI’s moving average, TSLA’s price fell by nearly 40%.
2. Trading on Overbought/Oversold Signals
a. Overbought Signal:
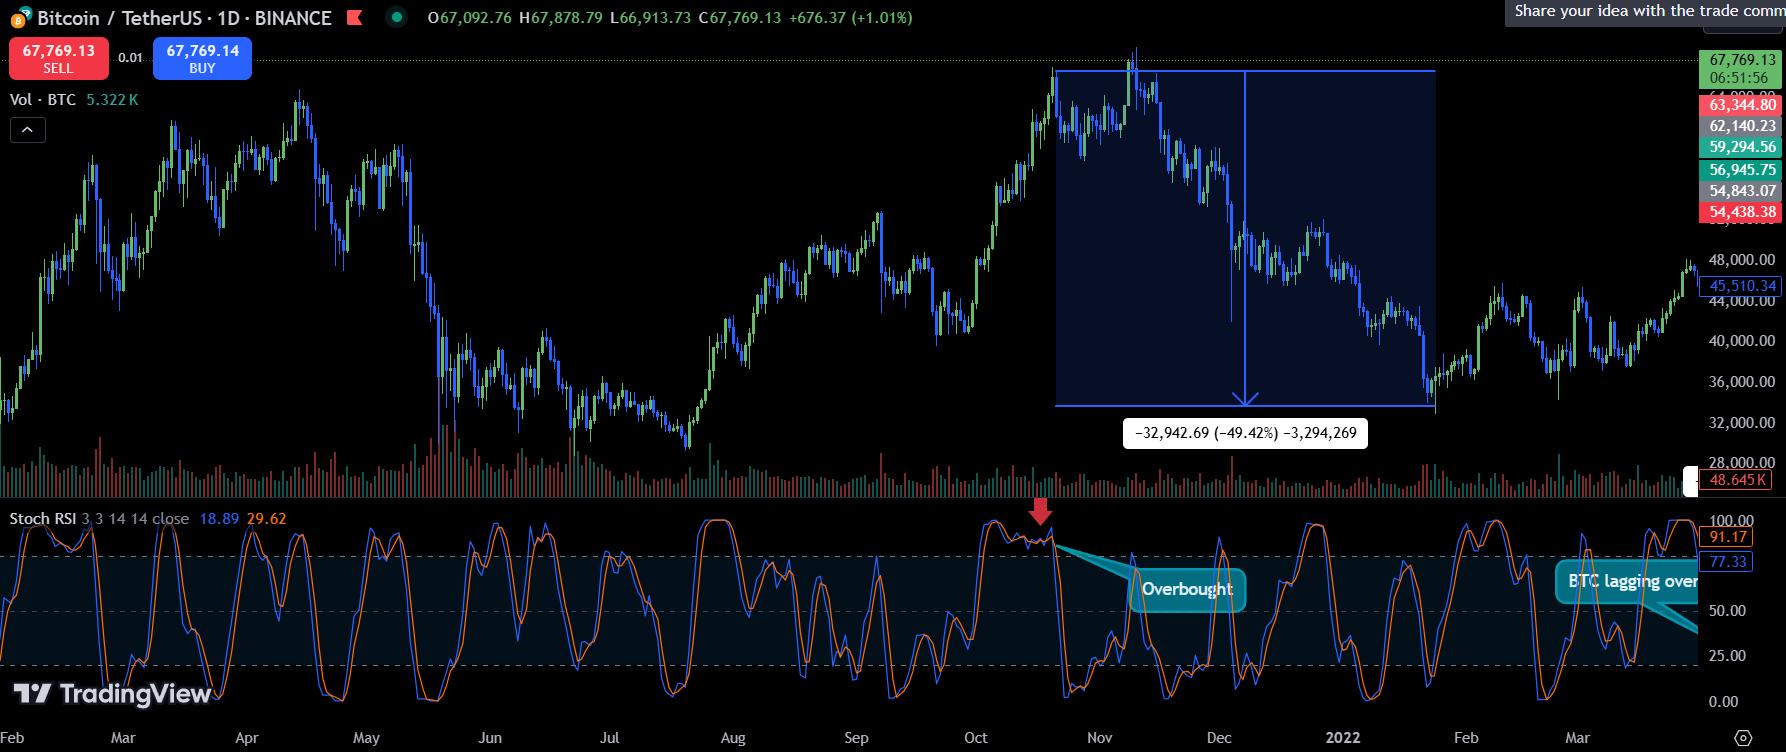
When the Stochastic RSI surges into the overbought zone (80–100), investors should consider selling, as the price may be too high to justify new buying positions. For example, when Bitcoin (BTC) neared $68,000, the Stochastic RSI hit close to 100. After this overbought signal, BTC’s price dropped by nearly 50%.
b. Oversold Signal:
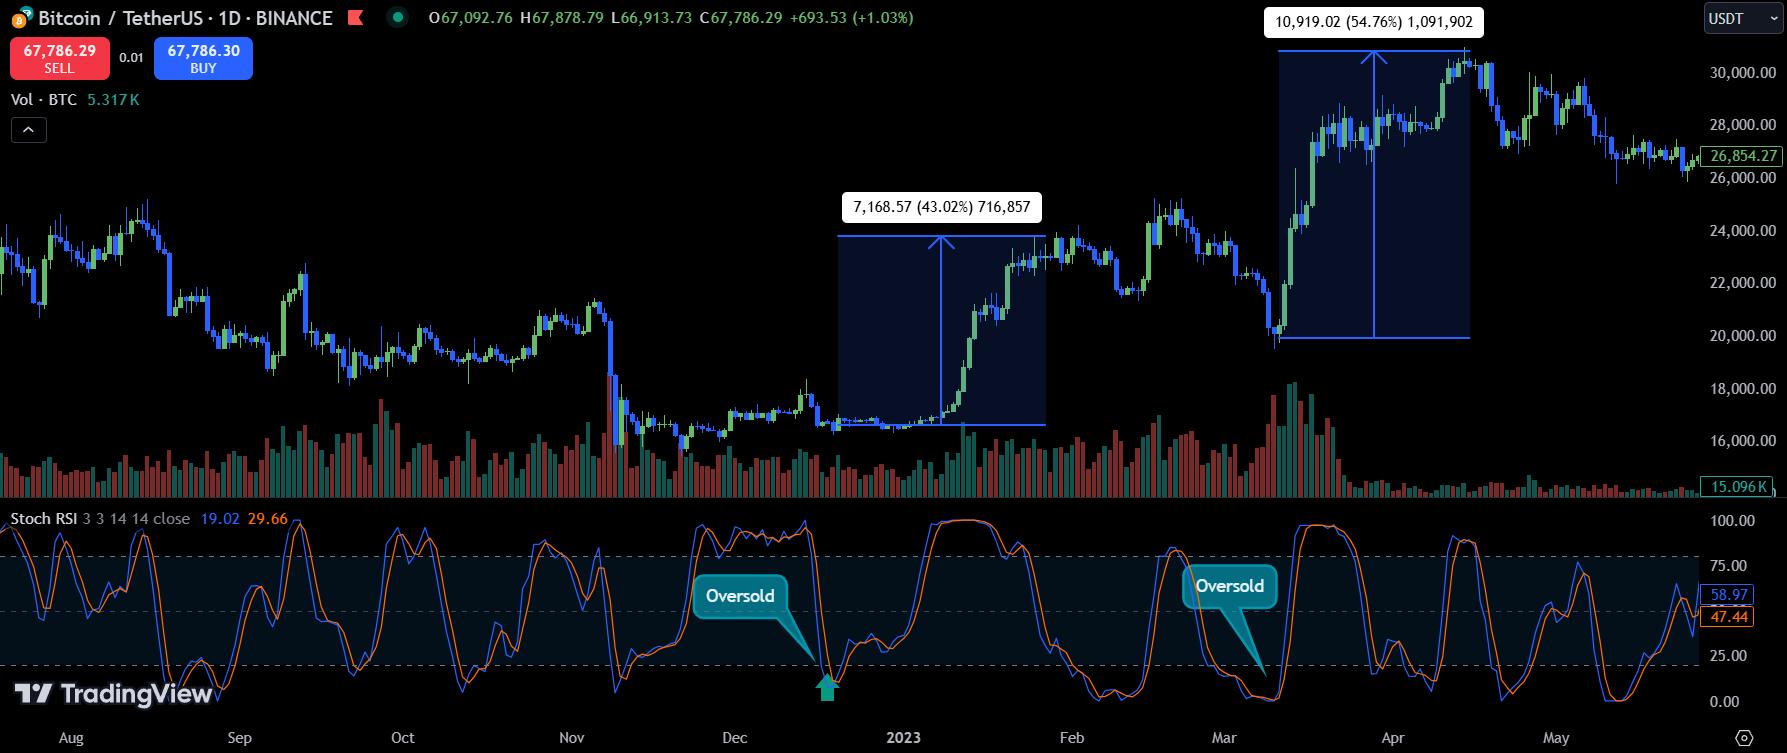
When the indicator falls below 25, investors should consider buying, as the price may be undervalued. For example, when BTC hovered around $16,000 and the Stochastic RSI hit an oversold level below 25, BTC’s price subsequently rose by 43%. In a similar situation, BTC later increased by 54%.
3. RSI Divergence
Divergence between price and Stochastic RSI is a critical signal that may indicate a trend reversal, valuable for predicting whether the market will continue or reverse. This is one of the most important signals of the Stochastic RSI indicator.
a. Bullish Divergence:
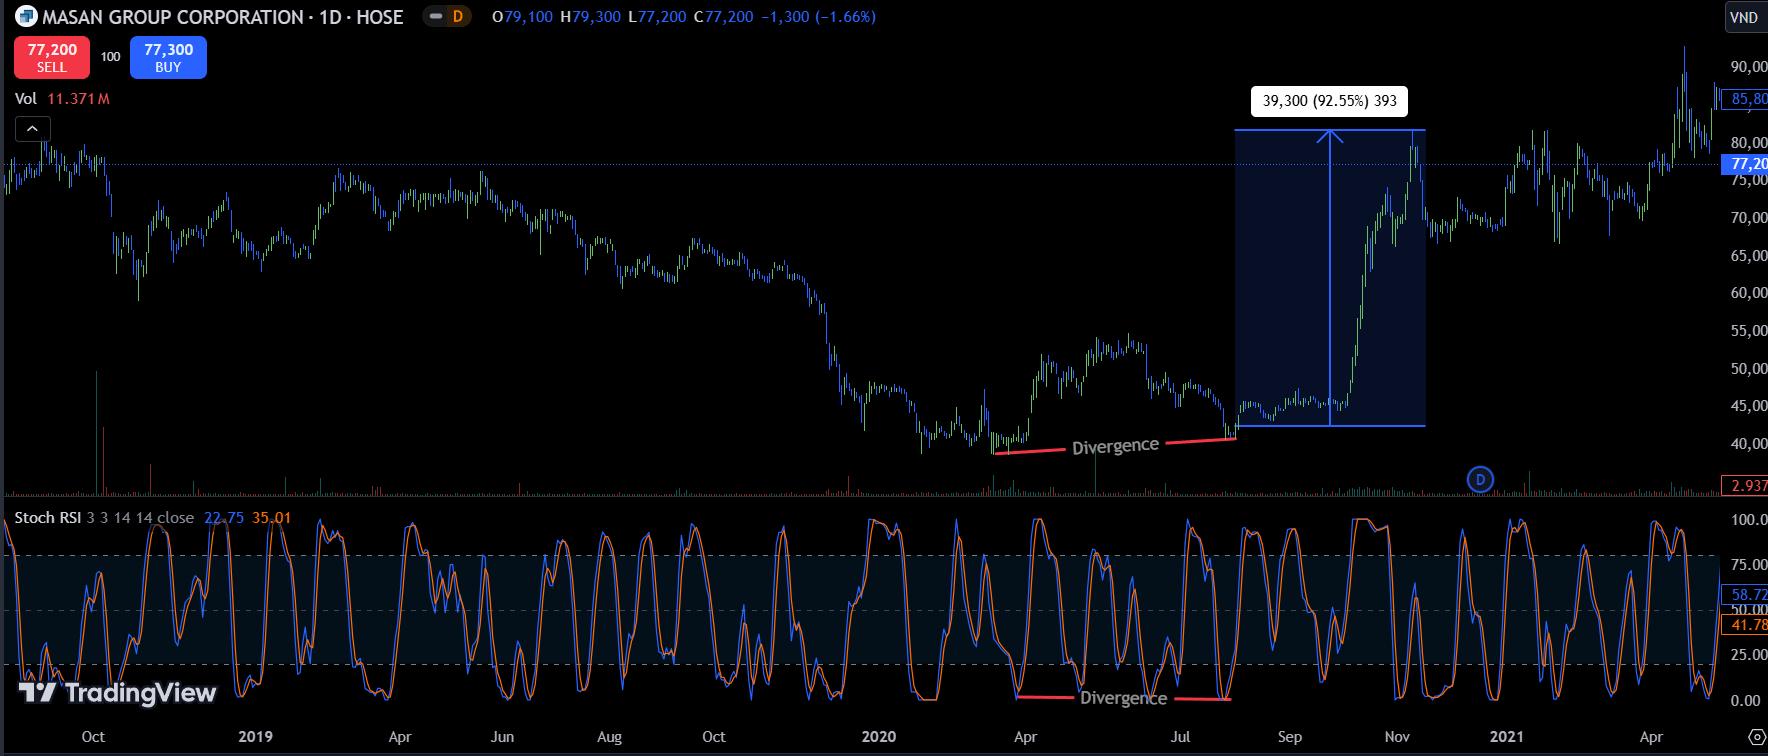
Bullish divergence appears after a significant price drop. Here, an asset (stocks, cryptocurrencies, indices) may show two or more consecutive bottoms, with the Stochastic RSI moving in the opposite direction. For example, Masan Group’s stock (MSN) formed two large bottoms around the 40,000 VND mark, with the latter bottom higher than the former, while the Stochastic RSI formed lower lows. This bullish divergence led to a nearly 93% price increase.
b. Bearish Divergence:
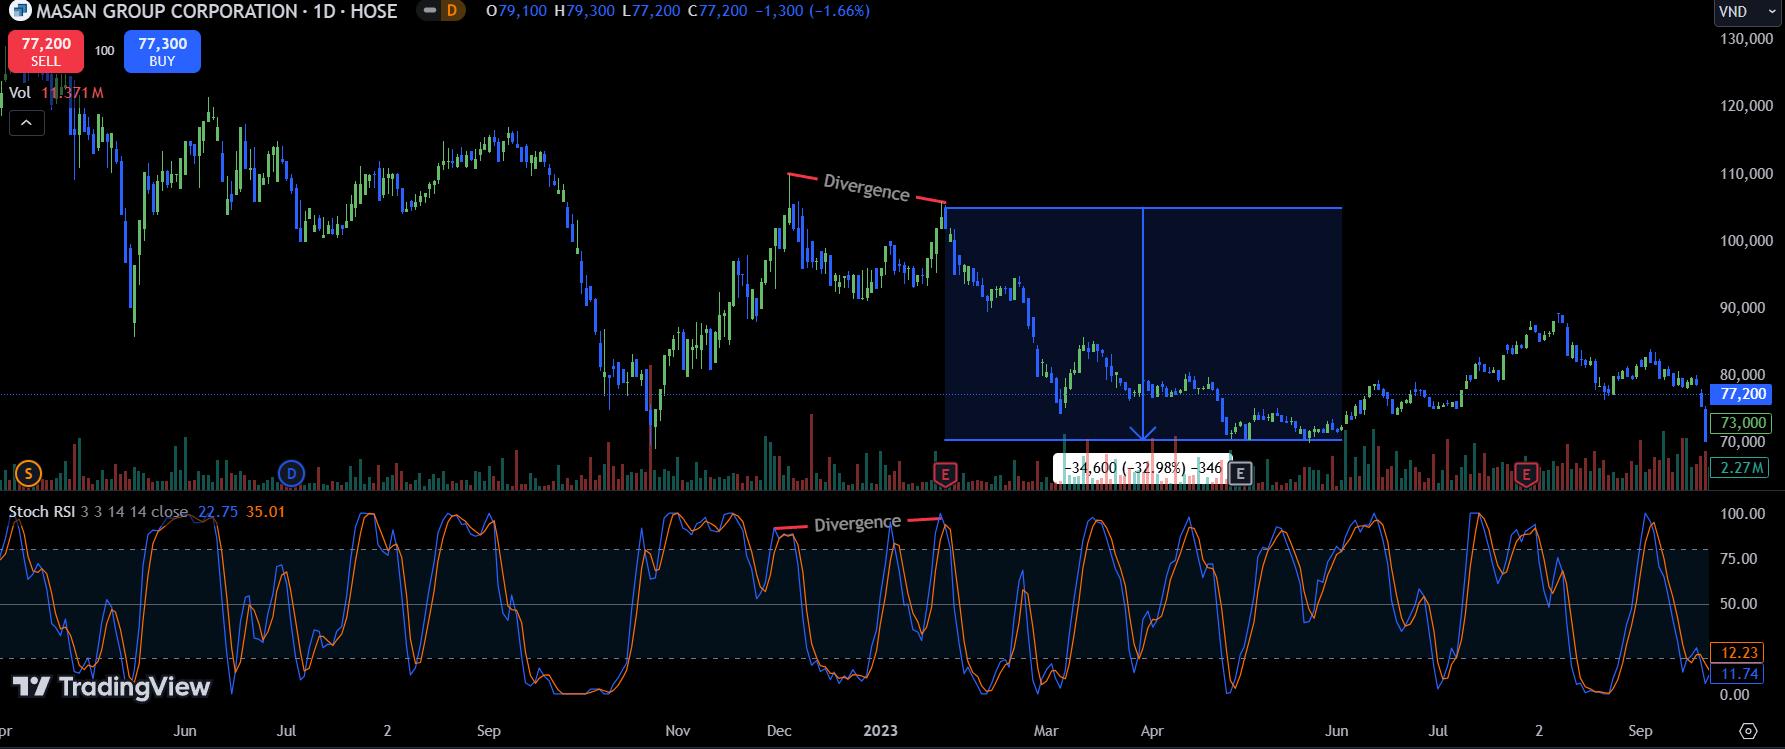
Bearish divergence occurs at peaks when prices form consecutive highs with the Stochastic RSI moving in the opposite direction. For example, with MSN stock, two consecutive peaks with the second peak lower than the first were followed by a higher peak in the Stochastic RSI. Following this bearish divergence, MSN lost 33% of its value.
v. Noise in the Stochastic RSI Indicator
1. Why Does Noise Occur?
Reading the theory above, you might think trading and investing are easy with the Stochastic indicator. But it’s not that simple. Stochastic RSI, like other indicators, has its own noise issues. If we’re not careful and don’t understand the indicator’s logic, we can make significant mistakes.
In simple terms, when the indicator reaches the overbought zone (80-100), it’s merely indicating that the uptrend is very strong. Since the indicator’s limit is 100, if it stays at 100 for a while, it’s because it can’t go any higher!
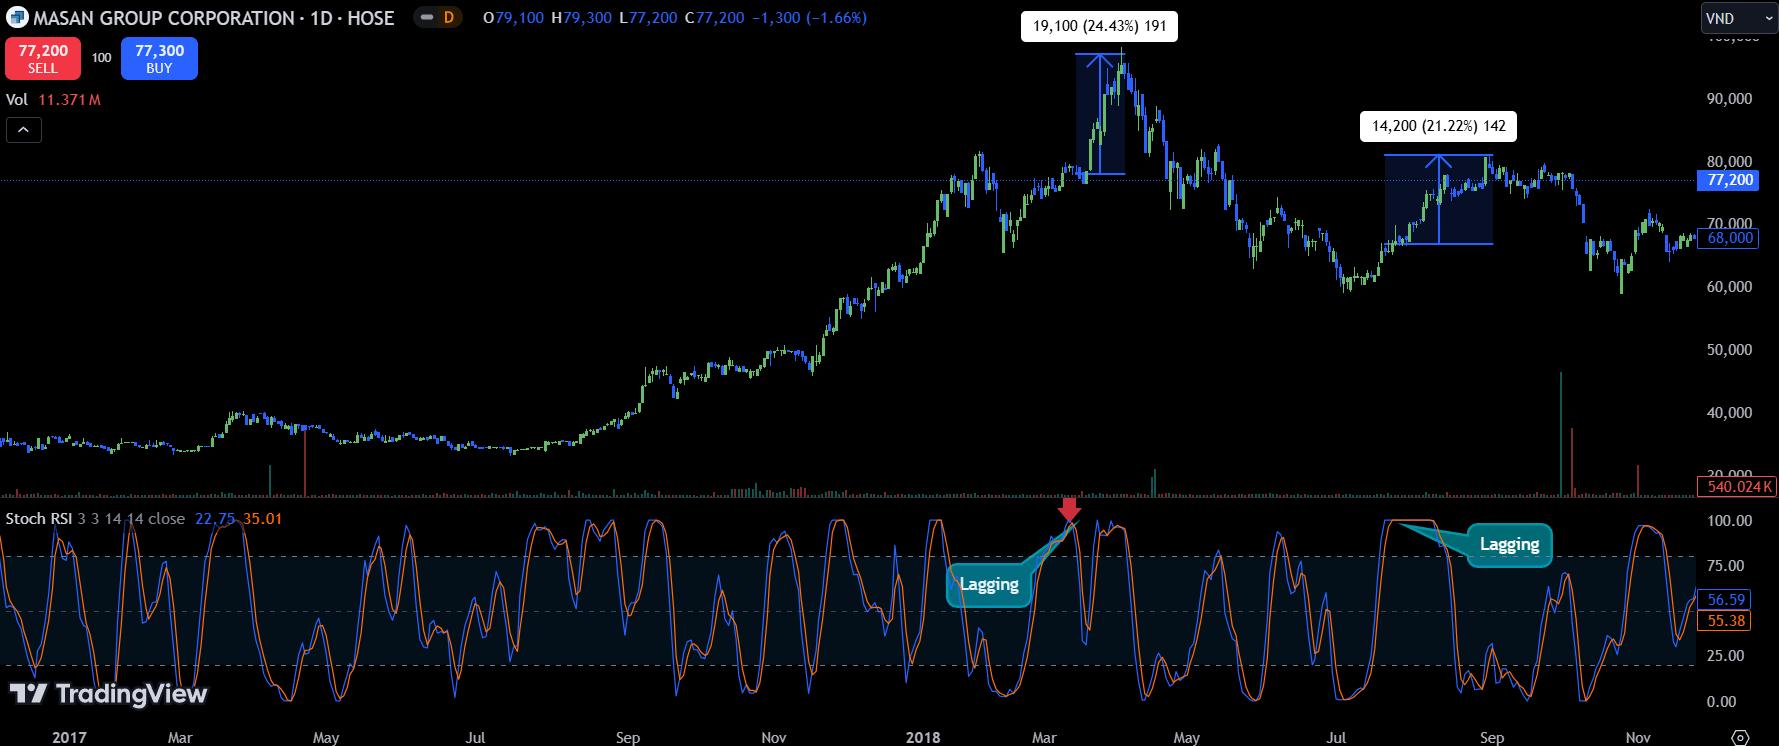
a. Example of Lagging Overbought in MSN Stock:
The indicator clearly reached the overbought level, but MSN stock continued rising by 24.4%. In another case, it increased by 20% while Stochastic RSI remained “stuck” in the overbought zone at 100.
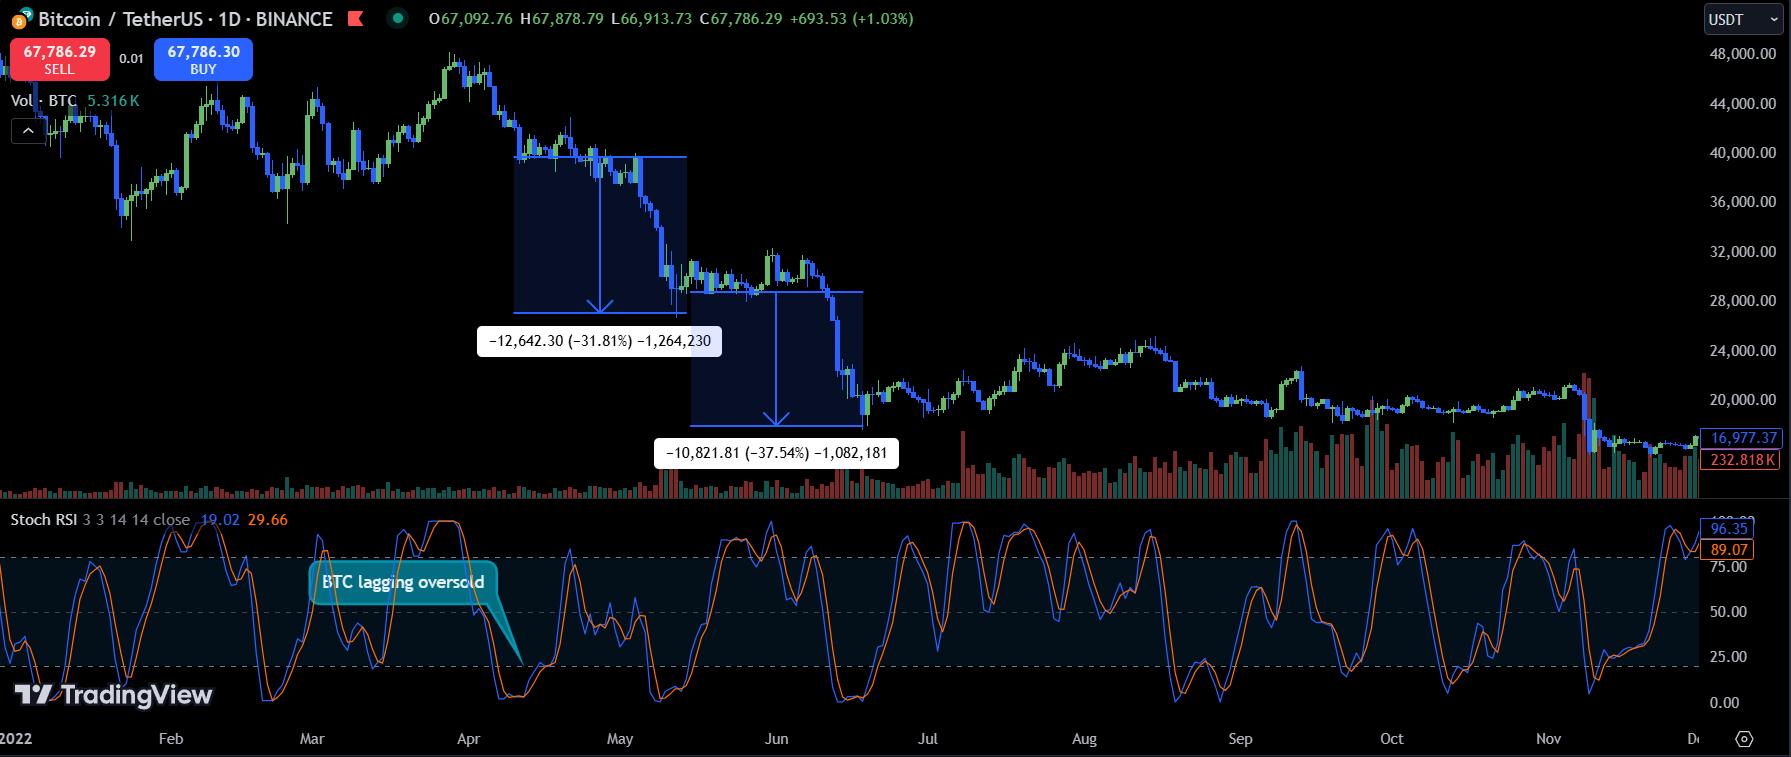
b. Example of Lagging Oversold in Bitcoin:
Despite an oversold signal near zero, BTC’s price dropped another 32%, and later even by 38%, signaling that selling pressure was still too strong rather than indicating that the price was cheap.
2. How to Address Noise
The Stochastic indicator is simple to use, but reducing noise is difficult because it’s essentially a mathematical formula. Although Stochastic RSI is an improvement over traditional RSI, it remains a basic indicator. But don’t worry; here are two ways to reduce noise.
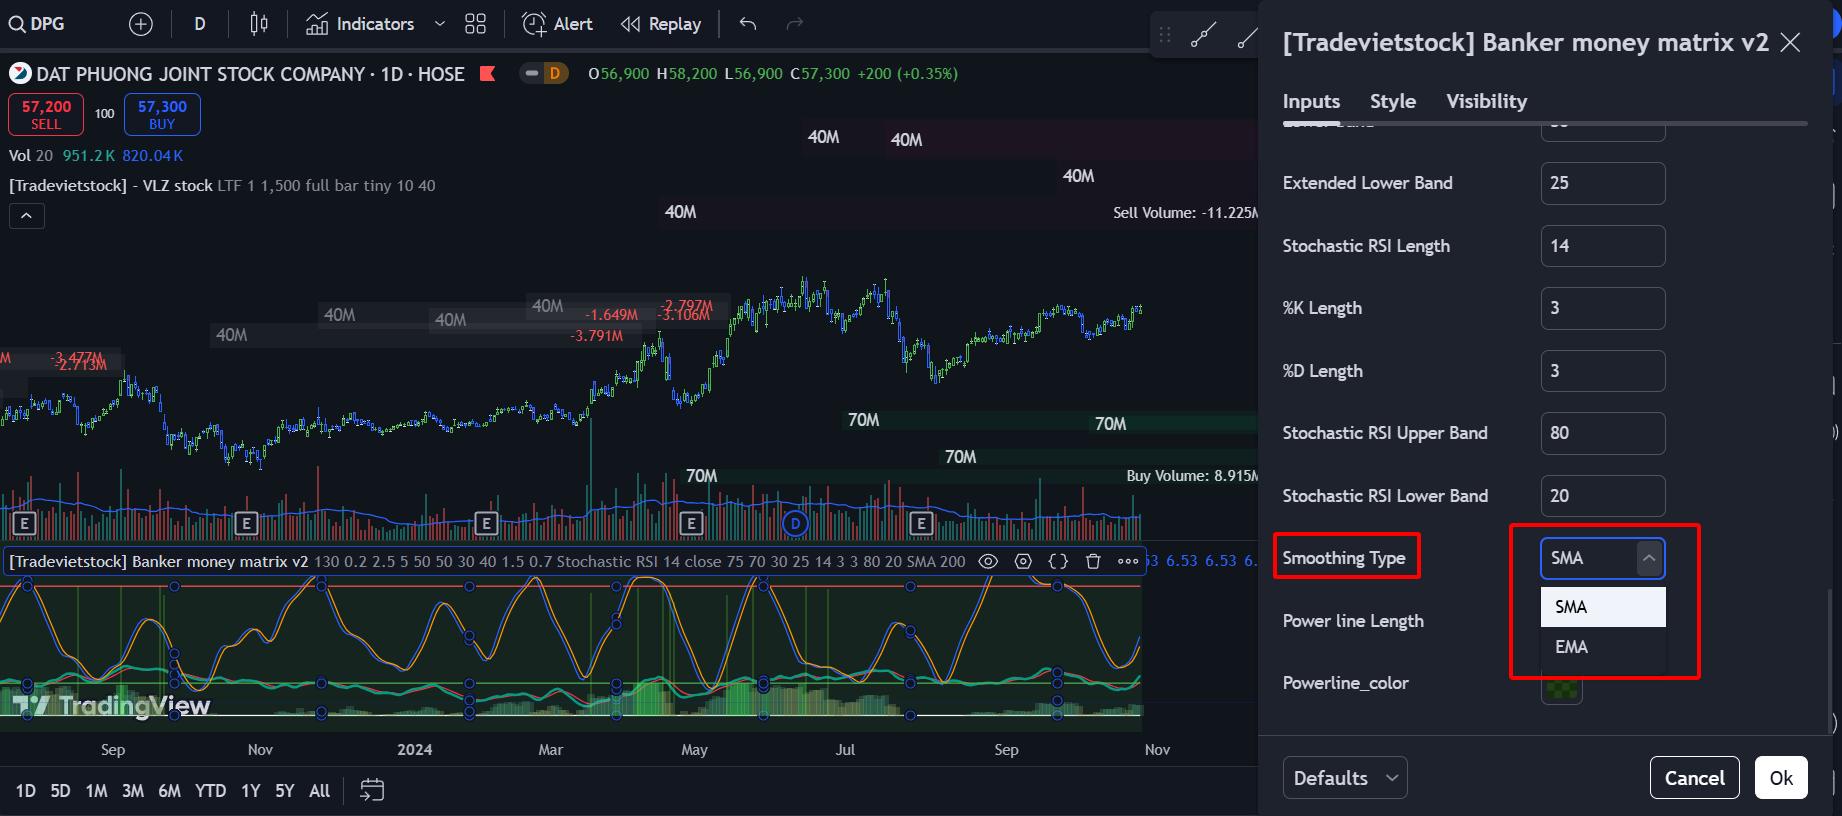
a. Smoothing the Stochastic RSI
Using simple moving average (SMA) or exponential moving average (EMA) smoothing can help. This method may be complex for those unfamiliar with coding indicators or algorithms. However, for those who can, it’s a useful approach. Below is one of Trade Viet Stock’s trading strategies, incorporating a customized Stochastic RSI smoothed by EMA or SMA.
b. Waiting for Price Confirmation
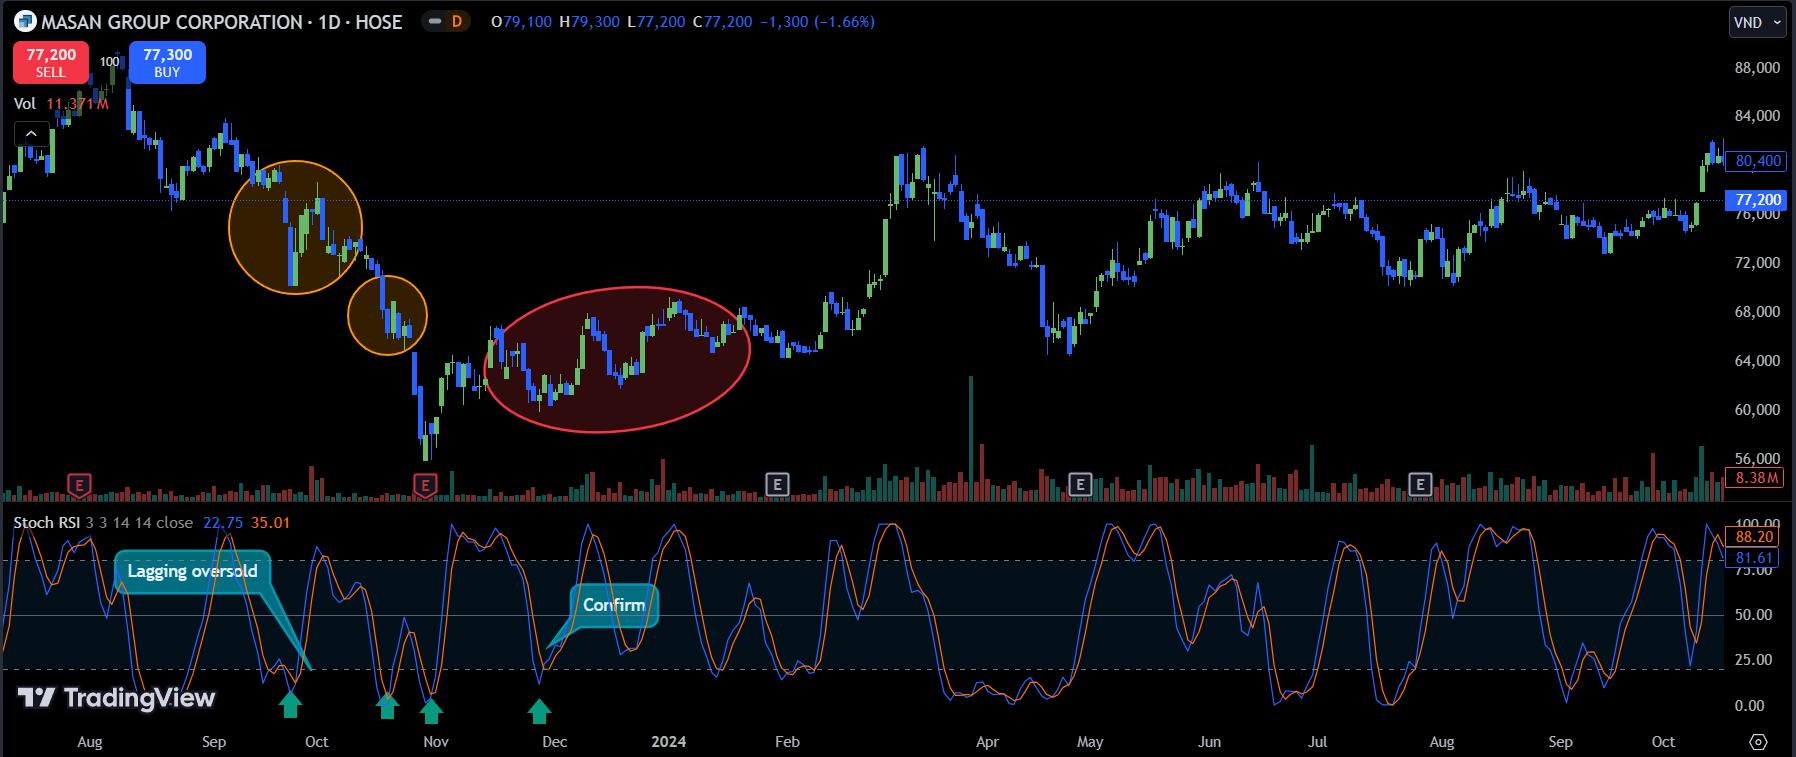
Instead of jumping into trades immediately upon seeing an overbought/oversold signal and risking losses due to lag, why not wait for a confirmation signal? This could be a candlestick pattern, a series of highs/lows in the Stochastic RSI, or divergence.
For example, instead of buying immediately on the first oversold signal, the admin waited to observe the following days. No strong upward candlesticks appeared; instead, there were strong bearish candles with high volume. So, they waited. On the second oversold signal, there was still no strong upward movement. Finally, after noticing a sequence of higher lows (indicated in red), accompanied by multiple oversold Stochastic RSI signals, they observed a stronger buying force. This was the cue to start buying MSN.
c. Combining Multiple Indicators
Along with Stochastic RSI, you can use other basic indicators for confirmation:
- Trendline: Determine the main trend, then use Stochastic RSI to find entry points.
- Moving Average (MA): Combine EMA200 with Stochastic RSI to find buy/sell points in uptrends and downtrends.
Feel free to add other indicators like Bollinger Bands, Ichimoku, or even your friendly neighbor for insights! 🙂
vi. Conclusion and Opening a Trading Account
That’s our guide on “How to Use the Stochastic Indicator.” We hope this helps you understand both the basics and more advanced applications of this indicator. Below is a link to register for one of Vietnam’s top 10 stock accounts. We’ll update this article with any new insights, so be sure to check back!

If you want to learn more about stock market investing and crypto/forex trading tips, stay updated on the Trading Guide!
Wishing you all success in your investments!
 Cộng đồng blog chia sẽ kiến thức cộng đồng


